

Tallinn, Estonia
In ancient times they had no statistics so they had to fall back on lies. – Stephen Leacock
In almost every situation where data can be collected and analyzed, we are faced with comparisons of that data to itself. This is sometimes a useful technique – but not always. For example, school grades can be used to compare one student to another, identifying the top 10%tile of students as well as the bottom 10%tile of students. This might have meaning; it might be that the top 10%tile deserve scholarships and other opportunities, while the bottom 10%tile deserve remediation. We naturally stigmatize the bottom 10%tile and applaud the top 10%tile. But this can be, in certain situations, wholly artificial.
Is the goal of education to stratify students into percentiles? No. The goal is for students to achieve competency in a curriculum. Not all students will achieve competency in a given curriculum, particularly as the subject matter gets more difficult (achieving competency in kindergarten has little correlation with achieving competency in medical school). But, in any event, the goal should be that students achieve some predefined level of competency. That’s not to say that some students won’t achieve that goal easier than others do, nor do I claim that comparing students to one another is unimportant. We certainly do need to identify those advanced students so that they can attempt more advanced competencies. But my point is that when we compare groups of students to one another, that is a different thing from deciding whether a student is competent. In other words, belonging to a certain percentile, in and of itself, is absolutely meaningless.
A class full of 100 high-achieving students may all one day have great academic success and they may all be competent in their chosen endeavors; nevertheless, one of them still constitutes the bottom 1%tile. Similarly, a class full of 100 poor achieving students, none of whom will ever achieve significant success, still has someone in the top 1%tile. Thus, the sample group being compared to itself matters immensely. We know this already from life experiences. Earning a B grade in an advanced physics class at MIT surely has more merit than an A grade earned in an introductory science course in a community college. But this false comparison, forced on us by what I call the Percentile Fallacy, applies to all sorts of descriptive statistics.
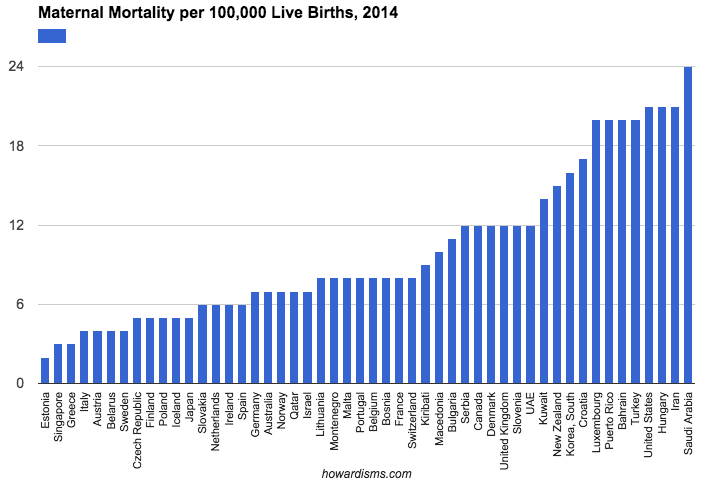
Consider, for example, the 50 best countries in the world as ranked in regards to maternal mortality (or any other metric you might be interested in). The difference between 1st and 50th may be substantially insignificant. In fact, considering error in collecting data (poor reporting, differences in labeling, sampling size, etc.) along with differences in populations (e.g., differences in risk factors among the various populations), there may be no real substantial difference between 1st and 50th place that’s not attributable to chance alone (and therefore just noise in the data). But, yet, some country will always come in 1st place and some country will always come in 50th place.
I won’t spend a lot of time dissecting the problems with maternal mortality reporting around the world, but note above that Estonia is ranked 1st in this report while the US is ranked 47th. Does Estonia really have the most advanced maternity care in the world? No.
Estonia averages about 14,000 births per year (compared to about 4 million in the US). The small sample size of countries like Estonia and Iceland tend to make them look very good (often having just 0 or 1 maternal death in a given year). There are single hospitals in the US that deliver more babies per year than Estonia or Iceland (and I personally have delivered more babies per year than Liechtenstein, Monaco, and San Marino). Women with high risk conditions in Europe tend to travel out of these countries for maternity care, so the sample is diluted of complicated patients. Throughout different countries of the world, wide variation exists about what is considered a maternal death and how these deaths are reported and collected. Is any women with a positive pregnancy test who dies considered a maternal death? No, not ideally. In theory, the pregnancy should contribute to the death. So should a woman who dies of pneumonia or a pulmonary embolism four weeks after delivering a baby be considered a maternal death? These types of decisions are not made uniformly.
In the US, various projects aimed at increasing local identification of pregnancy-related deaths have found both significant under-counting of pregnancy-related deaths and also significant over-counting. We simply don’t know the real rates even with complicated tracking and recording systems. So how well can we expect Slovakia, with fewer obstetric resources than the state of Tennessee, to do with tracking its true maternal mortality rate? Yet Slovakia, according to the data above, has almost one-third the rate of maternal mortality of the United States. The truth is we cannot really use this data for a like-kind comparison. We can use data from 2014 Slovakia to compare it to 2013 Slovakia, but not to 2014 Oregon.
But these insignificant differences are parlayed by special interest groups and policy-makers into a crisis that needs rescuing for those poor, bottom-dwelling, low-percentile countries like the United States. These types of comparative statistical errors are rampant in nearly every aspect of science and public policy. As long as we have 50 states, some state will rank first and some state will rank 50th in every imaginable statistical category; and some politician or special interest group will exploit that 50th place ranking as a reason to change policies or laws, spend more money, and raise the public angst. But some state will always be 50th. Some country will always be near the last, and some student will always be near the bottom percentile.
The “problem” is not the country, state, or student, the problem is what I call the Percentile Fallacy. The percentile fallacy occurs whenever one member of a group is thought to be problematic compared to another member of the group not because they have failed to meet some objective standard but because they have to be on a different part of the bell-shaped curve.
Hospitals are guilty of the percentile fallacy every day. Hospitals collect troves of data comparing themselves to other hospitals. They may all be excellent (or they may all be horrible) but some hospitals will always constitute the “top performers” and others will be basement dwellers. What’s worse, reimbursement for services is moving towards the same erroneous formula, where hospitals and doctors who are in the top percentiles of some metric are rewarded with more money while those in the bottom percentiles are penalized by having money taken away. This is a zero sum game (which is why payers like it) and it doesn’t really identify competency (which should be the real goal). The top percentile performers may be woefully incompetent in some category and have no real incentive to improve, so long as they are just a teeny bit less crappy than everyone else. And in the other extreme, virtually every hospital or provider may be doing a good, competent job, but some will still be penalized because there will always be those bottom percentiles. We need thresholds of good performance, not percentiles.
The percentile fallacy is pervasive in life. It does little to promote actual competency and rather promotes learning how to play the data-collection game well. It rewards those who understand the formula, which often has little basis in true competency. In healthcare, most performance metrics are picked because of ease of access to data that can be computed by some central organization. For example, in obstetrics, a widely proposed “quality metric” may be whether all pregnant women are screened for gestational diabetes during their pregnancies. This test is chosen not because it is important but because it assumed by policy makers that it should be occurring universally and because the data is available (since a charge is submitted by the physician for this service).
Now the competent, evidence-based approach to this issue of screening is to screen first with history and then to perform a chemical screen on high and average risk women (not low risk women). But because this artificial measure of competency is erected, all physicians will start doing the sometimes unnecessary (and sometimes harmful) chemical screens even on low risk women. The bottom-dwelling outliers are not likely to be generally incompetent obstetricians but, rather, ethical, evidence-based providers who couldn’t bring themselves to harm their patients by doing the wrong thing.
Eventually, in such an incentivized system, physicians will all play the game and make sure every patient gets screened (no doubt some will submit charges even if the test didn’t actually get done so that they don’t get financially harmed). They will all learn to play the game. This could be used for good if physicians were incentivized to do something truly essential, but there are few examples of this type of incentivization. So what happens when the top performing physicians all screen 100% of their patients and the bottom performing physicians all screen 99.5% of their patients? Well, there will still be a top quartile and a bottom quartile, and someone will get bonused for no good reason and someone will get penalized for no good reason. This is the percentile fallacy in action.
Put another way, the percentile fallacy leads to harm whenever it is inappropriate to make such comparisons. We shouldn’t be interested in such false comparisons; rather, we should be interested in certain levels of performance or competency.
Here’s another example: Let’s say we instituted a quality measure than stipulated that any obstetrician with a total cesarean delivery rate less than 25% will be financially rewarded. This reward should be available to every single doctor, if they can achieve the standard. This is a competency based approach. The alternative is to use percentiles. If we used the percentile instead, physicians will all aim for the better percentile and work to lower their cesarean delivery rates; this could be good in the short term. But eventually, the best performing docs, having been overtaken or matched by everyone else, will strive for even lower cesarean rates. This would be acceptable incentivization if a cesarean delivery rate of 0% were desirable – but it isn’t, and we don’t know what rate is too low. Eventually, patients will be harmed by physicians not performing appropriate cesareans so as to maintain their prime reimbursement status. In this way, and in thousands of comparable examples, the percentile fallacy is harmful.
I started with an education example, and this is an important misuse of the fallacy. Our goal in education has to be competency. Students should not receive credit for a course or a degree if they cannot perform certain skills and possess certain knowledge and attitudes. We encourage students to game the system with our current system of standardized tests, a pump-and-dump attitude towards knowledge, and little emphasis on critical thinking skills. Thus, the majority of people who have graduated with degrees are incompetent. Don’t believe me? You probably made an A in calculus in college (if you are reading this); care to evaluate some indefinite integrals? I didn’t think so. Of course, that probably wasn’t the goal of your calculus course; but if it wasn’t, then what was? We must clearly define expected goals and competencies, or nothing has meaning. What are the competencies of a good physician? How should we define those (and demand them)? Our system of merits must enforce these competencies, but our current system rewards unethical behavior and patient harm.